Agent Charts with Code Mode and Vega-Lite
Giving an agent the ability to plot something usually means handing it a plotting library and hoping the code it writes is safe. Code Mode plus Vega-Lite is a tighter fit: the model writes its analysis code inside a sandbox, then emits the chart as a JSON spec that gets rendered outside it.
Motivation
- Say a user needs to make charts after doing some light data analysis.
- Need to run the analysis and charting code in a sandboxed environment, so that the model can generate the chart without having access to the filesystem or network.
- For this we can use CodeMode, which allows the model to write code in a sandboxed environment (here: Monty).
- For Charting, we can turn Matplotlib into a tool, but this is not a clean solution, and may raise security issues with model writing arbitrary code.
- Vega-Lite is a good alternative: specs are plain JSON, and should be in model training data.
Background
Code Mode: allow agents to write code instead of the usual tool calling, which allows for a more expressive and efficient operation.
Monty: A minimal sandbox for running python. Used by pydantic-ai’s CodeMode.
Vega-Lite: A JSON grammar for declaratively defining charts.
You also need a tool to get the data from, for me I have a tool that allows models to run DB queries. (With timeouts and only read access ofc)
And a tool to pass the generated json into Vega-Lite Converter, which converts the spec into an image
How it works
You can combine all these items into a flow like this
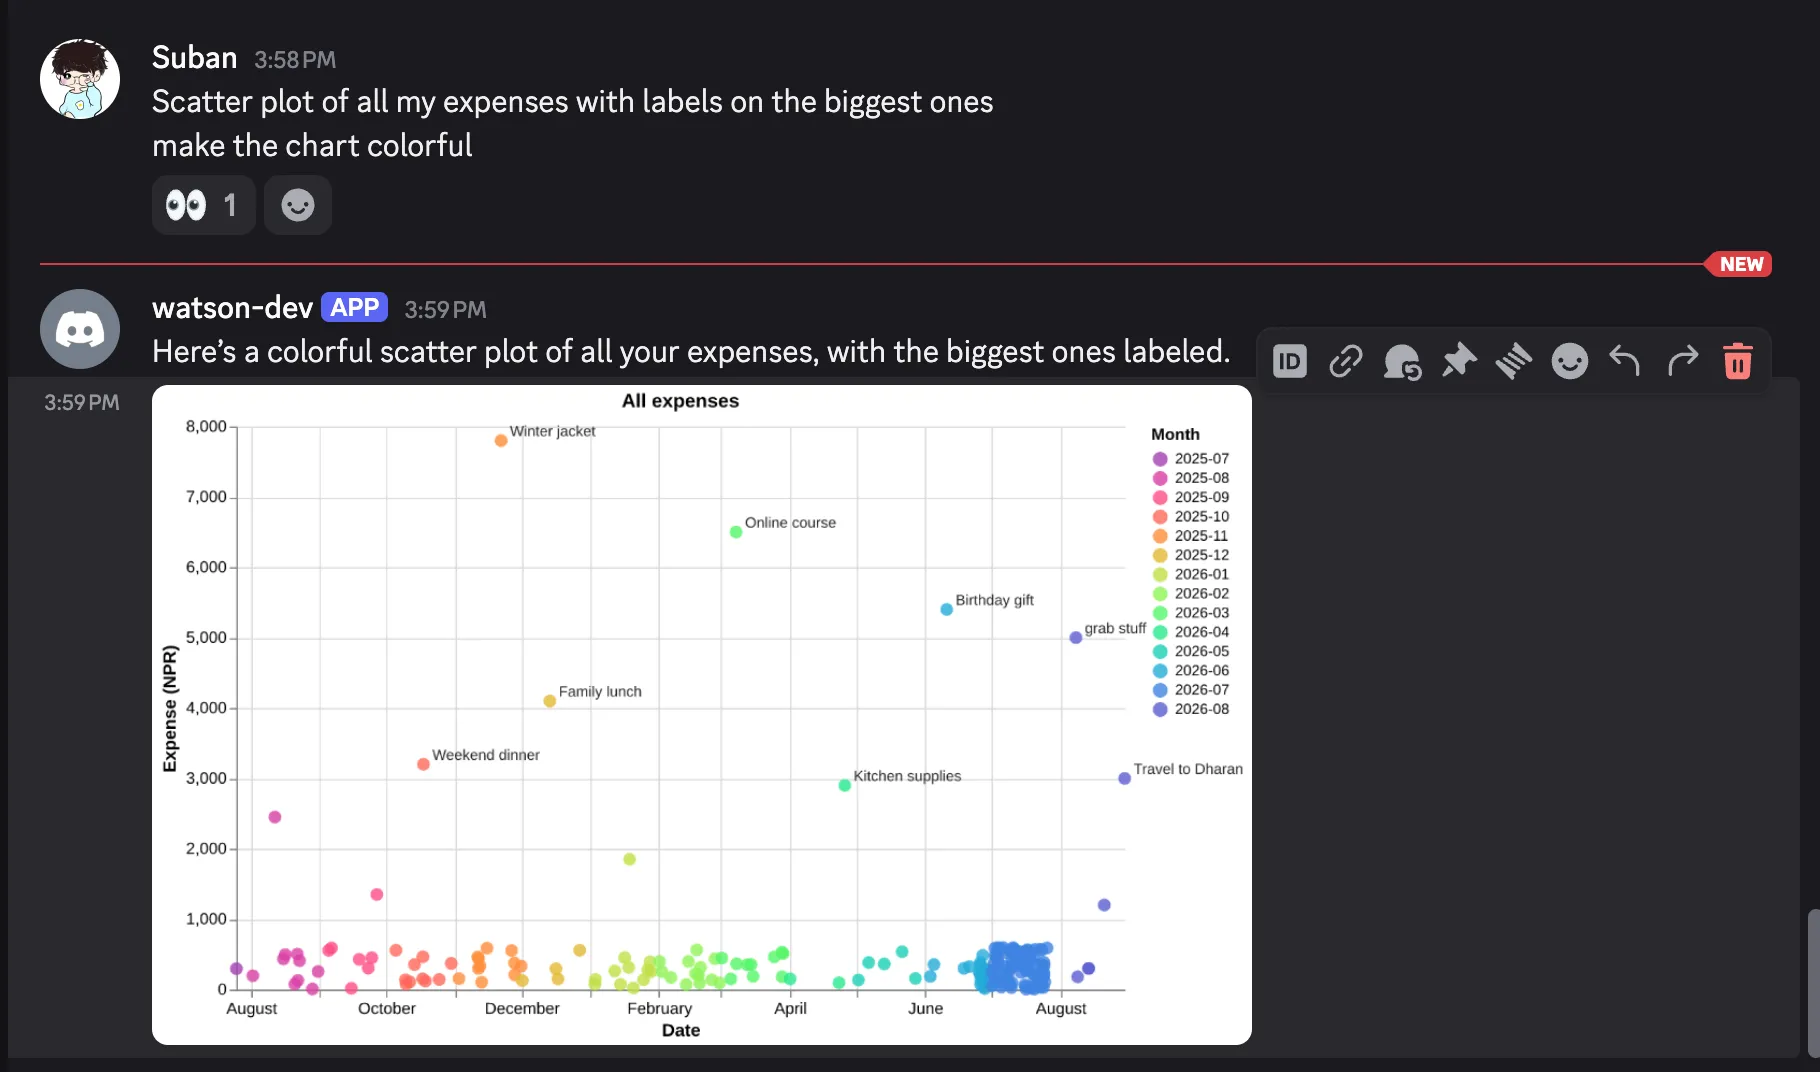
Message: Scatter plot of all my expenses with labels on the biggest ones
Now the model does a series of tool calls by writing code in CodeMode, and the final output is a chart.
Model first loads the data
rows = await query_database(query="""SELECT date, amount, title
FROM transactions
WHERE is_expense = TRUE
ORDER BY date ASC
LIMIT 500""")
rows
Once it sees the underlying structure, it can add some light code to transform the data in the correct format and generate the chart like such. On the next code generation
rowsfrom initial call is accessible.
sorted_rows = sorted(rows, key=lambda r: r['amount'], reverse=True)
top_ids = set(id(r) for r in sorted_rows[:10])
values = []
for r in rows:
    values.append({
        'date': r['date'],
        'amount': r['amount'],
        'title': r['title'],
        'label': r['title'] if id(r) in top_ids else None,
    })
spec = {
    'title': 'All expenses',
    'width': 600,
    'height': 380,
    'data': {'values': values},
    'layer': [
        {
            'mark': {'type': 'point', 'filled': True, 'size': 65, 'opacity': 0.75},
            'encoding': {
                'x': {'field': 'date', 'type': 'temporal', 'title': 'Date'},
                'y': {'field': 'amount', 'type': 'quantitative', 'title': 'Expense (NPR)'},
                'tooltip': [
                    {'field': 'date', 'type': 'temporal', 'title': 'Date'},
                    {'field': 'title', 'type': 'nominal', 'title': 'Expense'},
                    {'field': 'amount', 'type': 'quantitative', 'title': 'NPR'}
                ]
            }
        },
        {
            'transform': [{'filter': 'datum.label != null'}],
            'mark': {'type': 'text', 'align': 'left', 'dx': 6, 'dy': -6, 'fontSize': 10},
            'encoding': {
                'x': {'field': 'date', 'type': 'temporal'},
                'y': {'field': 'amount', 'type': 'quantitative'},
                'text': {'field': 'label', 'type': 'nominal'}
            }
        }
    ]
}
await plot_chart(spec=spec)
Plot Chart Function
The plot_chart function looks like this.
async def plot_chart(ctx: RunContext[HandleAttachments], spec: dict[str, Any]) -> str:
    """Render a Vega-Lite v5 spec and send the chart to the user.

    Args:
        spec: The full Vega-Lite v5 spec, with the rows inline, e.g.
            {"title": "Expenses by category",
             "width": 600,
             "data": {"values": [{"category": "food", "amount": 10868.6},
                                 {"category": "transport", "amount": 5843.0}]},
             "mark": "bar",
             "encoding": {
                 "y": {"field": "category", "type": "nominal", "sort": "-x"},
                 "x": {"field": "amount", "type": "quantitative",
                       "title": "Spend (NPR)"}}}
    """
    if isinstance(spec.get("data"), dict) and "url" in spec["data"]:
        # URL fetch can make it unsafe
        return "Chart not rendered: put the rows inline in data.values, not a url."

    try:
        # to_thread: No blocking the event loop.
        png = await asyncio.to_thread(
            vlc.vegalite_to_png, json.dumps(spec), scale=2
        )
    except Exception as exc:  # an invalid spec: hand the message back for a retry
        return f"Chart not rendered: {exc}"

    # attachments send to output channel.
    ctx.deps.attach(f"chart-{len(ctx.deps.attachments) + 1}.png", png)
    return "Chart sent to the user."
Any invalid spec can be fed back to the model itself, creating a self correcting loop.
Example Output
Safety Guarantees for Chart
- Code runs in monty, with safety guarantees like no access to filesystem, network or library imports apart from a limited set.
- Passing the rendering to matplotlib or something similar would make the solution
- either be less expressive
- or, less safe
- Vega-Lite allows for
- URL param for the data, which is explicitly disabled
- Model can send requests to arbitrary internal and external urls, which can leak internal data.
- Also has sandboxed expression language for the renderer, with no network / file system access.
- URL param for the data, which is explicitly disabled
Limitations
- System that need more expressive charts than a png will need to build their own renderer and specs.